Weather Sites
Additional StFYC Weather Links - Central & SoCal, images & time-lapses, special events.NWS Bay Area - The Weather Field Office (WFO) in Monterey
NOAA nowCOAST - CONUS-focused weather w/ many overlays
Tropical Tidbits - Dr Levi Cowen's site with weather models and his excellent storm analysis when appropriate.
Windy - Excellent display of current weather and models.
L-36 Golden Gate - Weather from Lapworth 36 owners
Weather Underground - Started by Dr Jeff Masters, it was a great grass-roots weather site until it was purchased first by The Weather Channel, then by IBM.
SailFlow SF Bay - San Francisco site for SailFlow, a part of WeatherFlow. They also do iWindSurf, iKiteSurf, FishWeather, and WindAlert.
Sail Flow Anita Rock - Live data, recent history, and weather forecasts.
Weather Nerds - 'Nuf said.
COD Satellite & Radar - College of DuPage Weather Site.
NOAA/NWS Weather
NWS Main Page - The National Weather ServiceNWS Bay Area - The Weather Field Office (WFO) in Monterey
NWS US Map - The Continental US (CONUS) w/ radar & warning area overlays.
NCEP Main Page - The National Center for Environmental Prediction
WPC Main Page - The Weather Prediction Center
OPC Main Page - The Ocean Prediction Center
SPC Main Page - The Storm Prediction Center
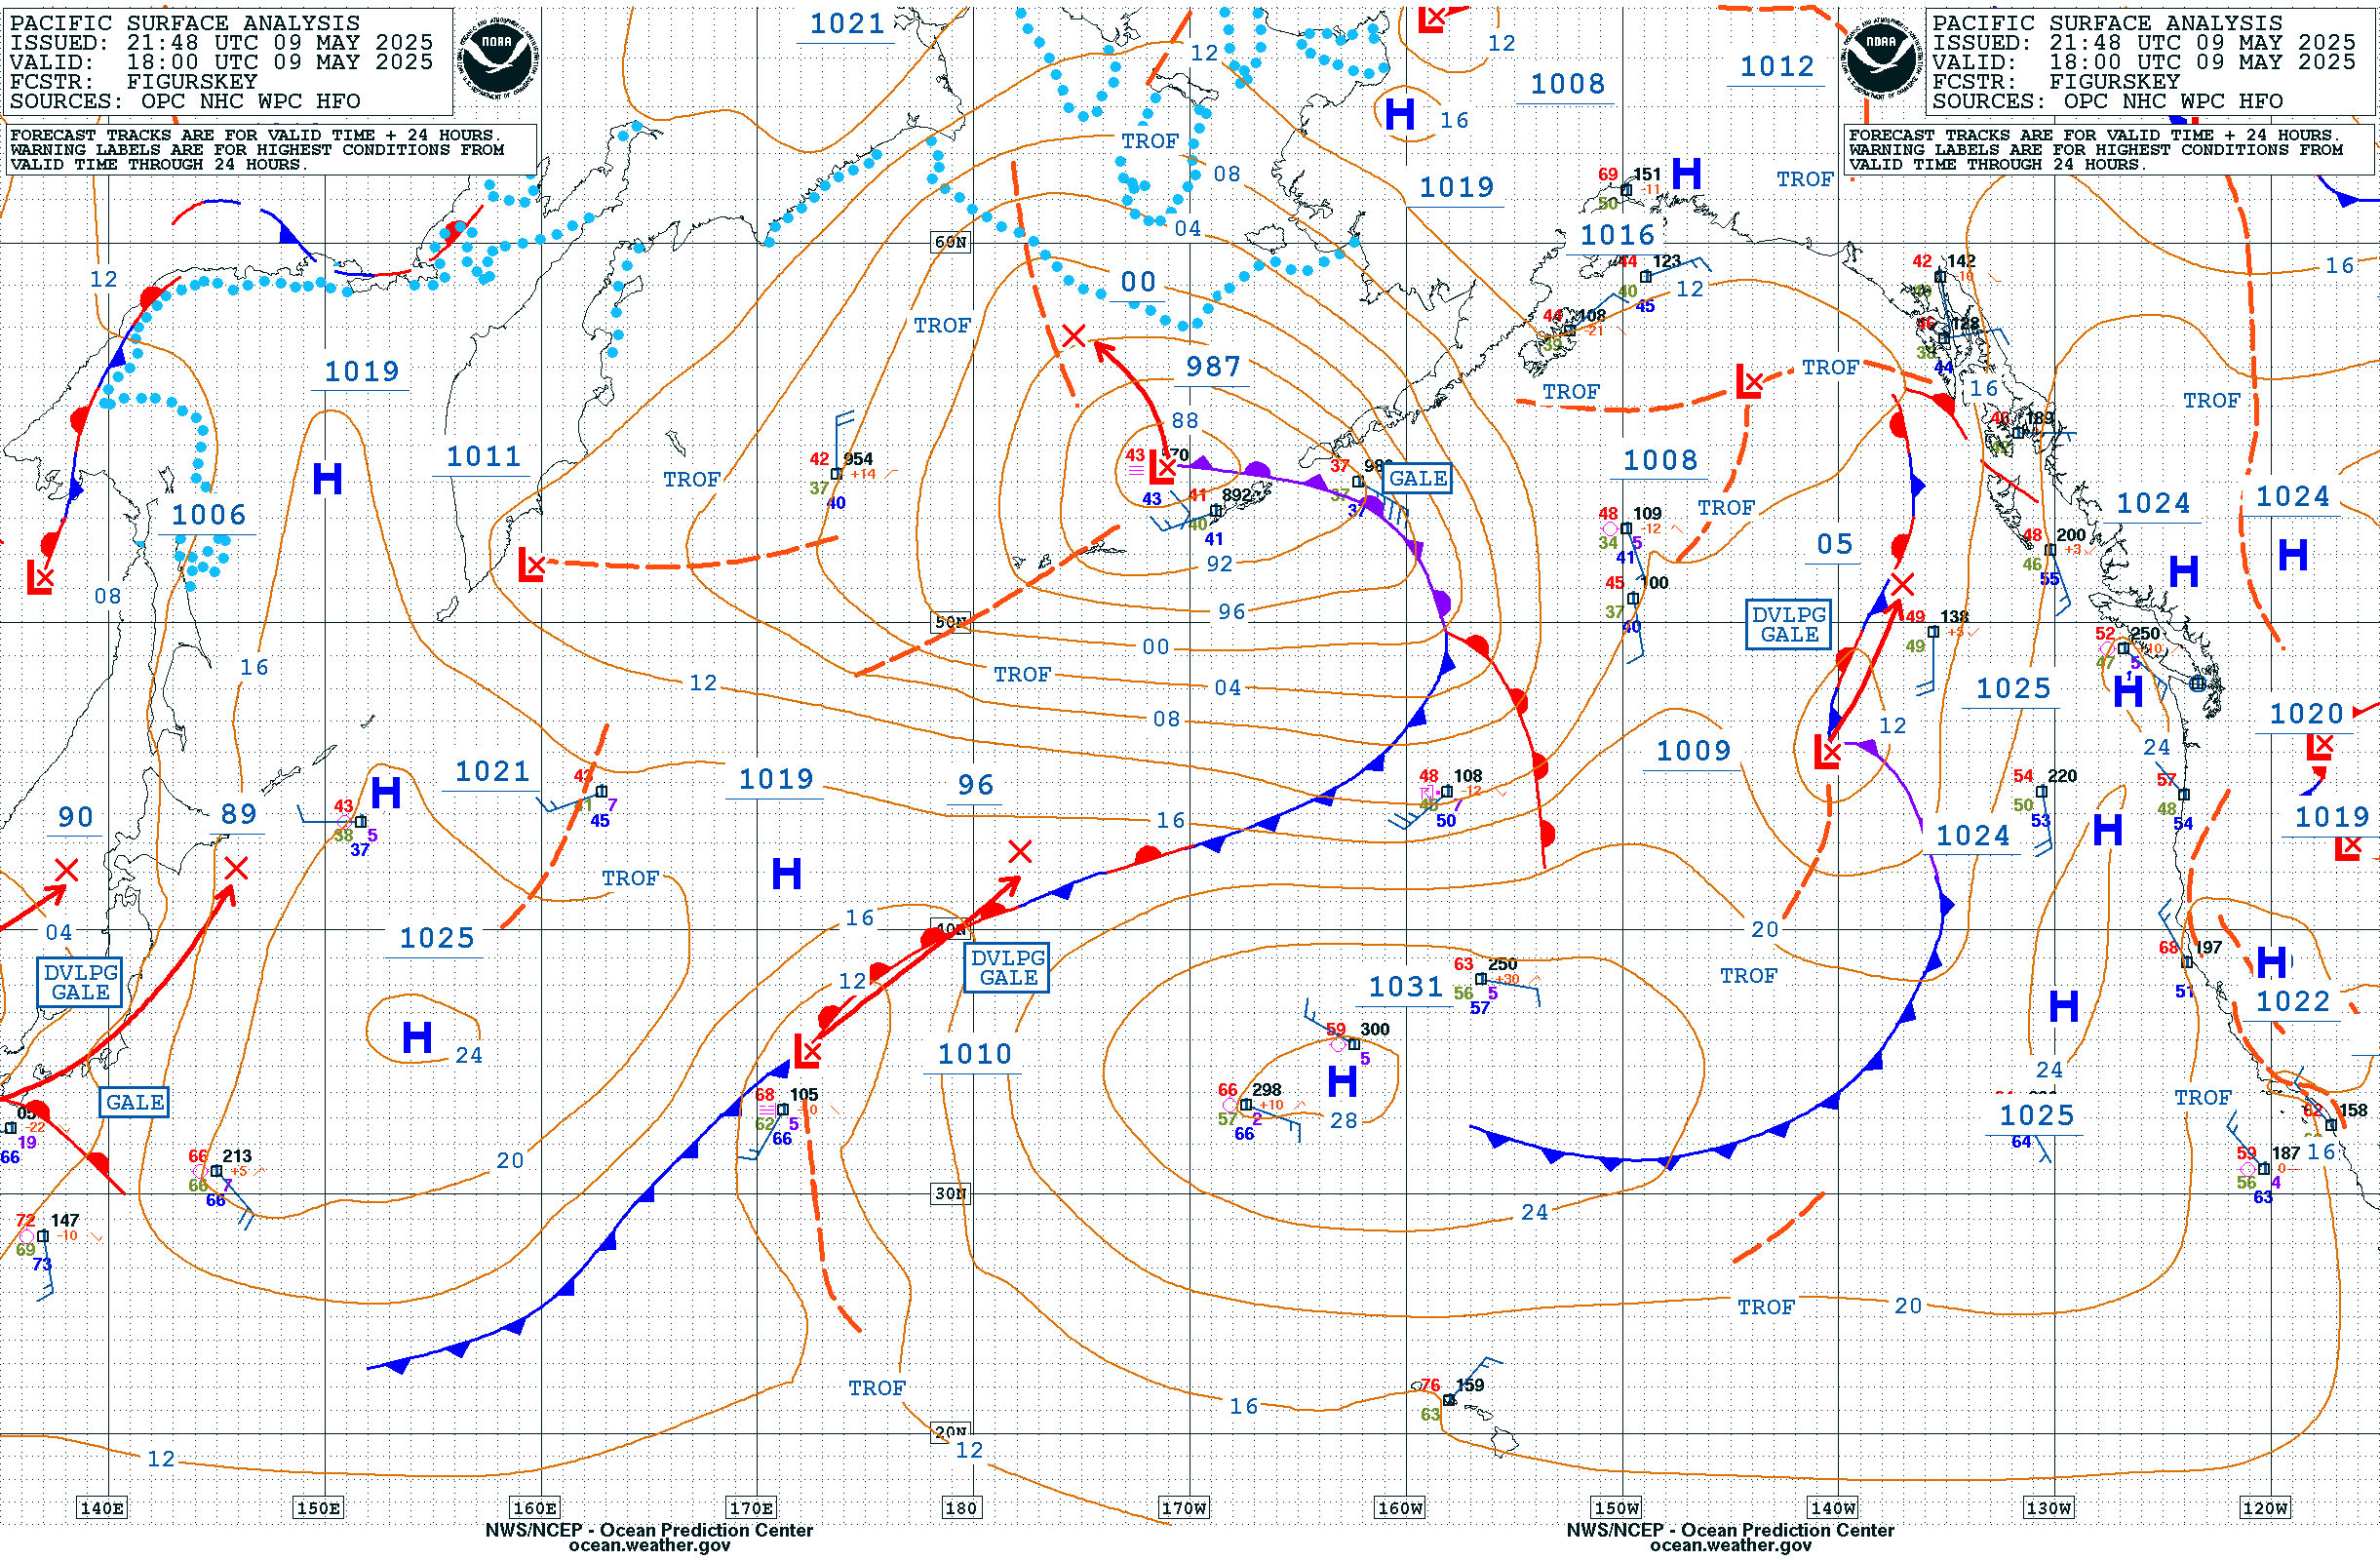
NOAA OPC Pacific - Ocean Prediction Center North Pacific.
NOAA Radiofax - Old School Radiofax Charts as broadcast over shortwave.
OSPO SST - Sea Surface Temperature from satellite observations.
SST California Coast - Local SST Analysis.
NDBC - The National Data Buoy Center
NDBC SF Approach - Buoy 46026 north of the Light Bucket
NOAA/NWS Modeling
NOAA NCEP - The National Center for Environmental PredictionNCAR WRF - National Center for Atmospheric Reaerch WRF model
NOMADS - NOAA Operational Model Archive and Distribution System - the model repository
Tides & Currents
NOAA's Tides & Currents -NOAA Tide Predictions -
NOAA PORTS - San Francisco Bay
NOAA OFS - SF Bay Operational Forecast System
Satellite Images
GOES West PACUS - NOAA's repository at NESDIS STARGeoColor GOES West image of Bay Area - From RAMMB / CIRA at Colorado St University
Data Sources
NOAA Oceanographic Data - A meta-server fronting many NOAA live and historical data sets-
"Everybody talks about the weather but nobody does anything about it" - Charles Dudley Warner

The current conditions shown at the top of the page come directly from sensors at StFYC and Tinsley Island.
An Airmar PB-200 above the Race Office has an ultrasonic doppler-based anemometer, thermometer, barometer, and several other sensors. It sends data once per second via NMEA-0183 to a computer over a RS-422 4800 Baud serial line (read and interpreted by bespoke StFYC software).
A WeatherFlow Tempest weather station above the Clippership Room and another on Tinsley Island have sensors for wind, rain, sunlight, temperature, barometric pressure, and lightning. Wind data is sent via WiFi every three seconds to a local system and WeatherFlow's network while other data is sent once per minute. Tinsley data comes via WeatherFlow's cloud-based APIs.
We use the Airmar for wind and the Tempests for temperature and barometric pressure. If the Tempests are not providing data the system falls back to nearby NOAA sites and there will be an asterisk next to the readings.
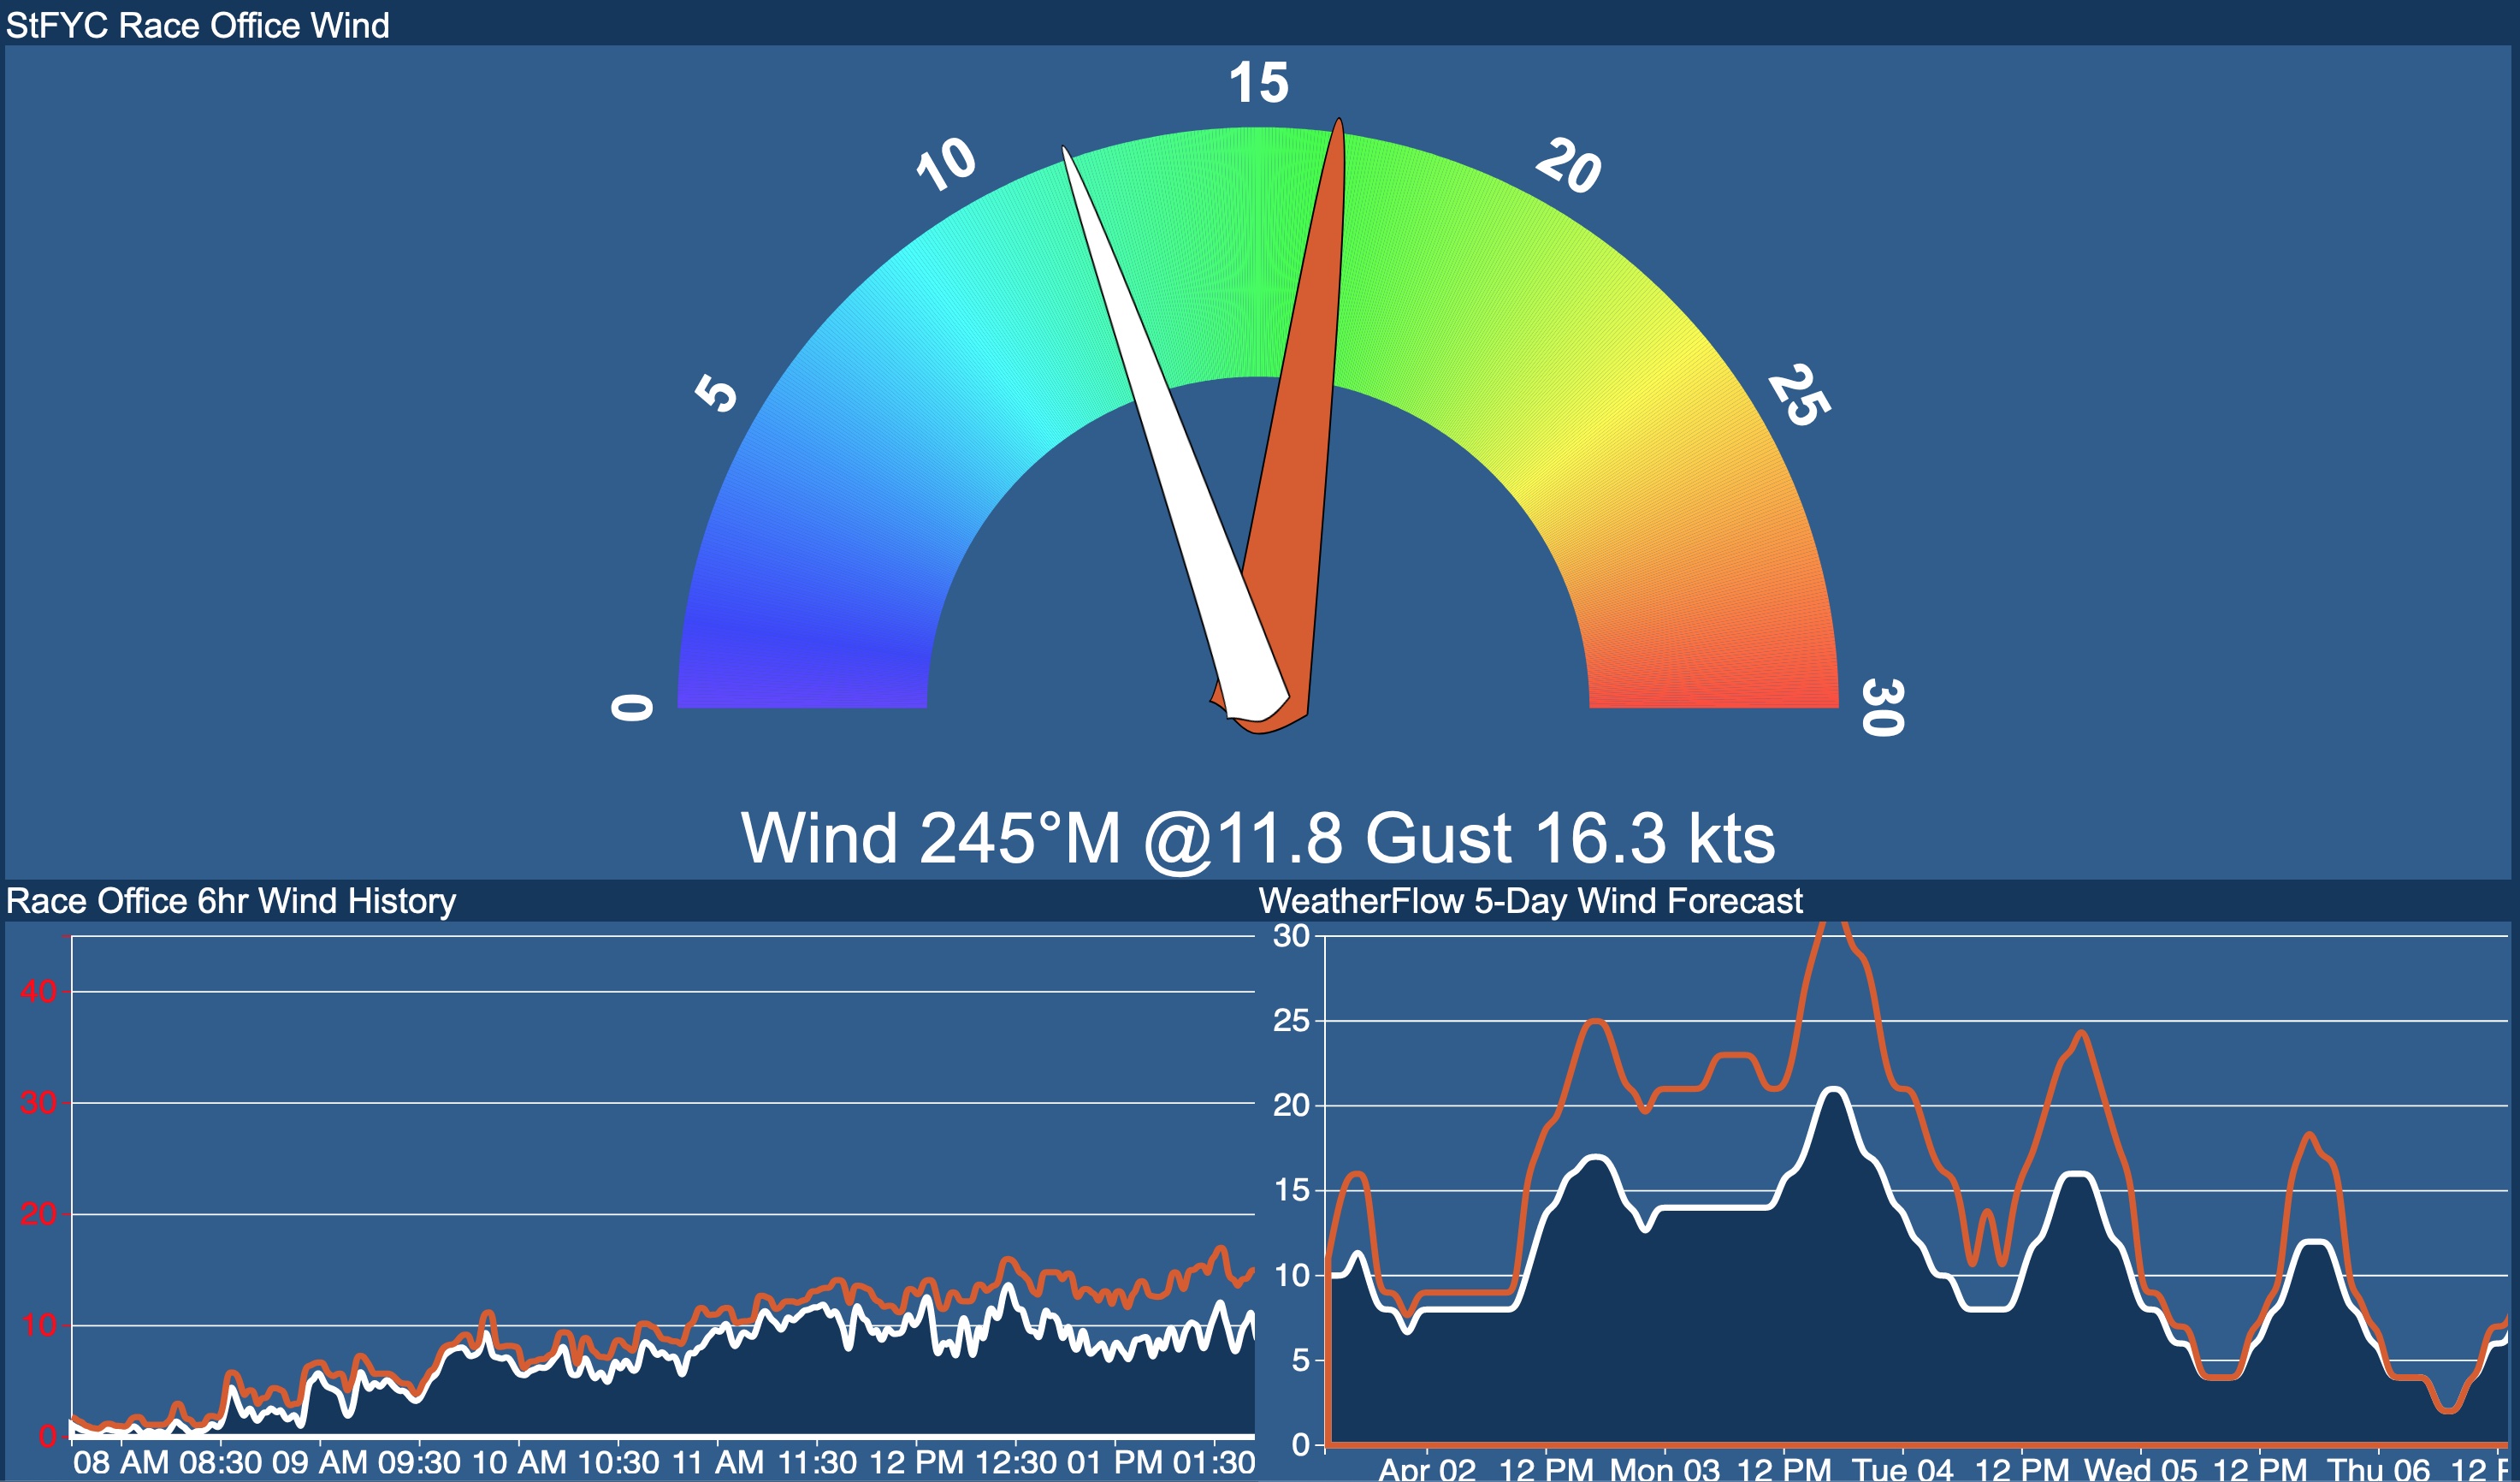
Current wind and recent wind history are from the Airmar above the Race Office. Wind strength is averaged over the last two minutes and gusts are the highest 1-second reading in the past two minutes.
If a gust has been over kts in the last seconds the display will switch to the wind display and the wind history graph's Y-axis increases to 45kts.
As of this writing the Airmar wind strength seems to be fairly accurate when the wind is above ~5kts while the Tempest always reads low. Neither give accurate wind direction. Inaccuracies are probably due to sensor location and may be addressed in the future by putting the Airmar on a taller mast.
Wind forecasts are from WeatherFlow.
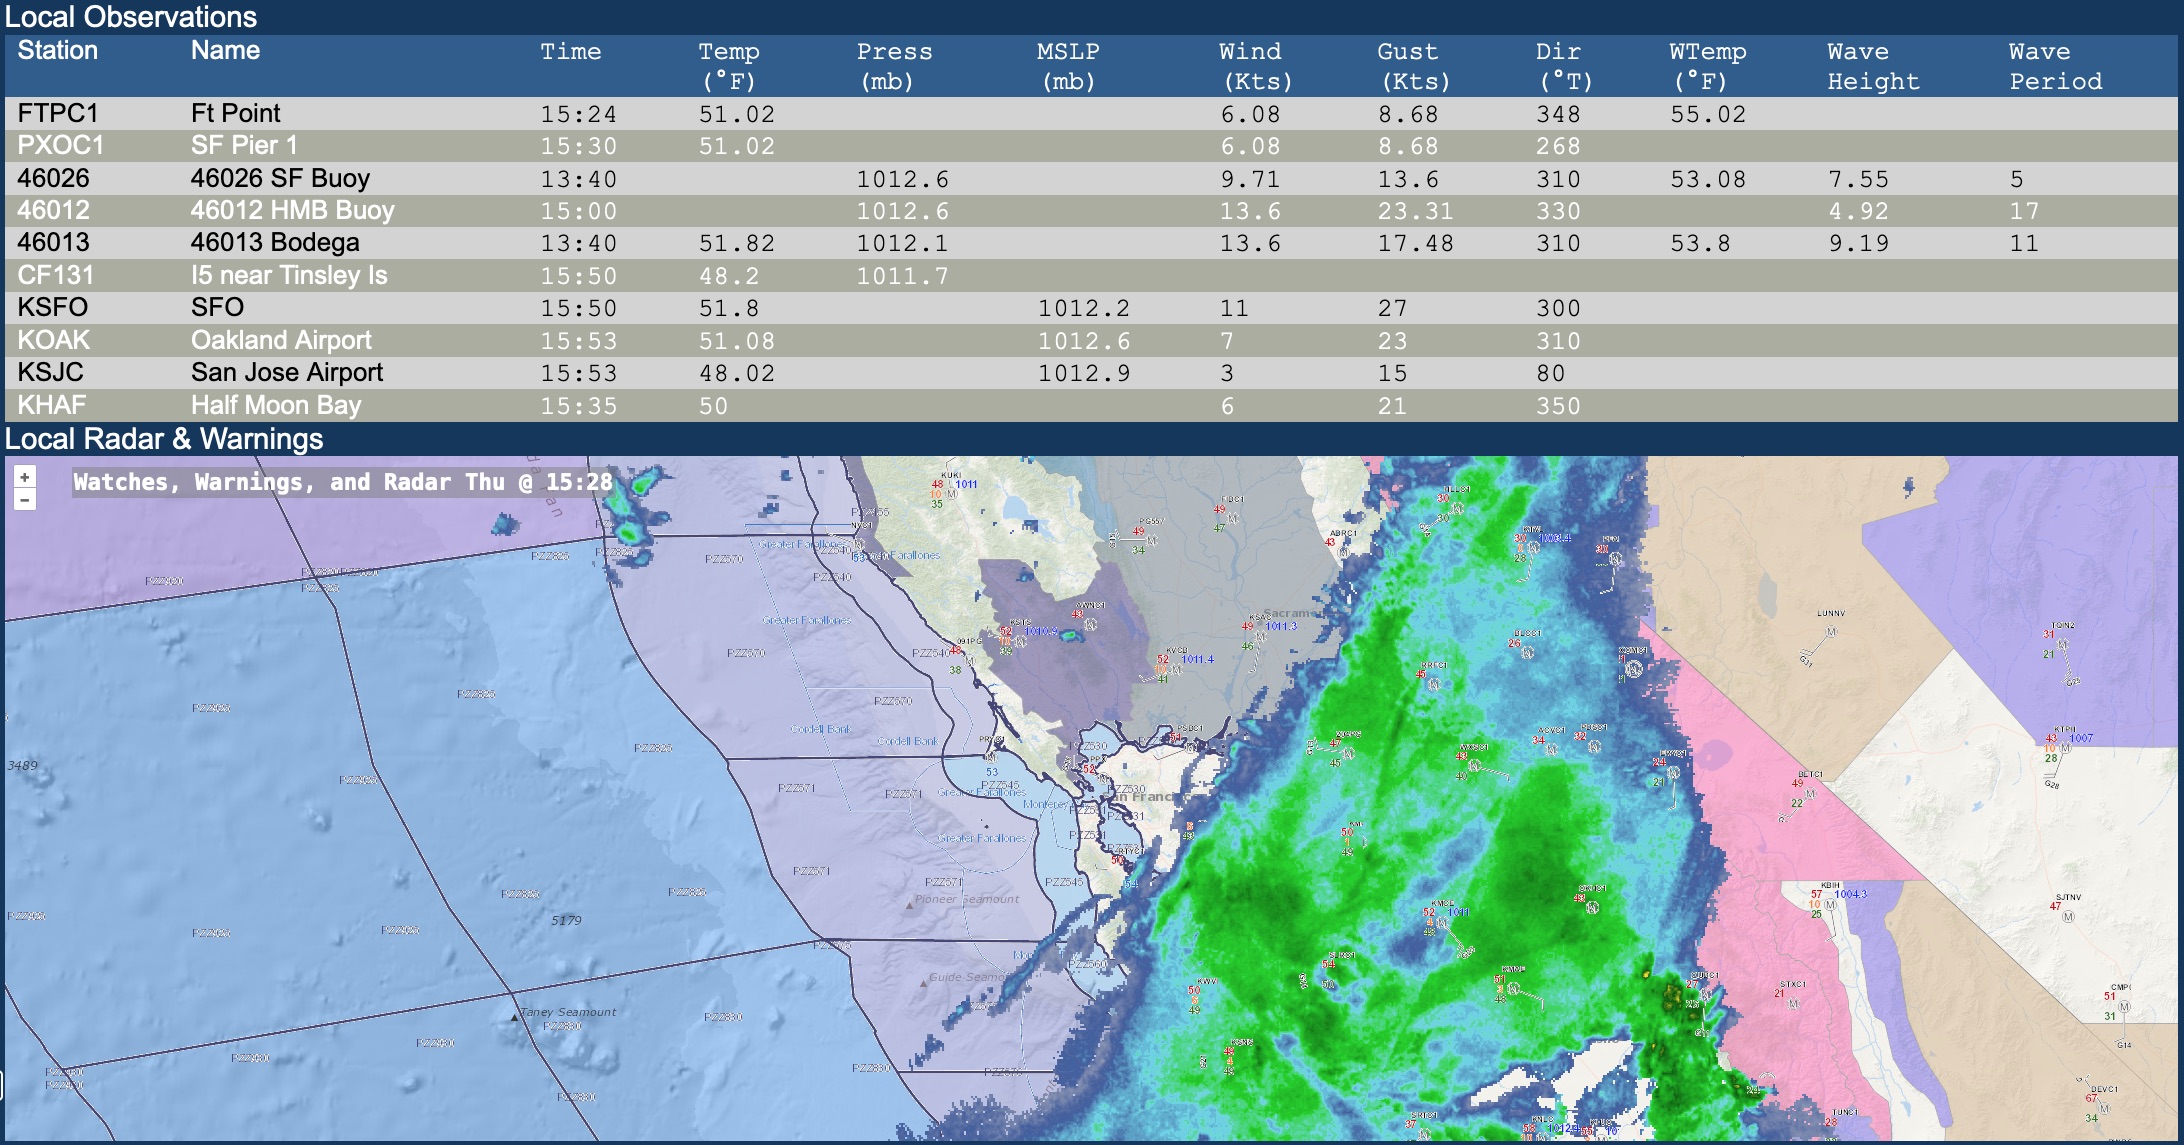
Current weather observations come from Synoptic Data which is contracted by the US Government to gather weather data from many sources and make it available for free via a web API. This database does not seem to be updated as frequently as the sensor sites so it may be a bit stale.
Local radar and warnings are from NOAA's NEXRAD composite system and the National Weather Service (NWS).
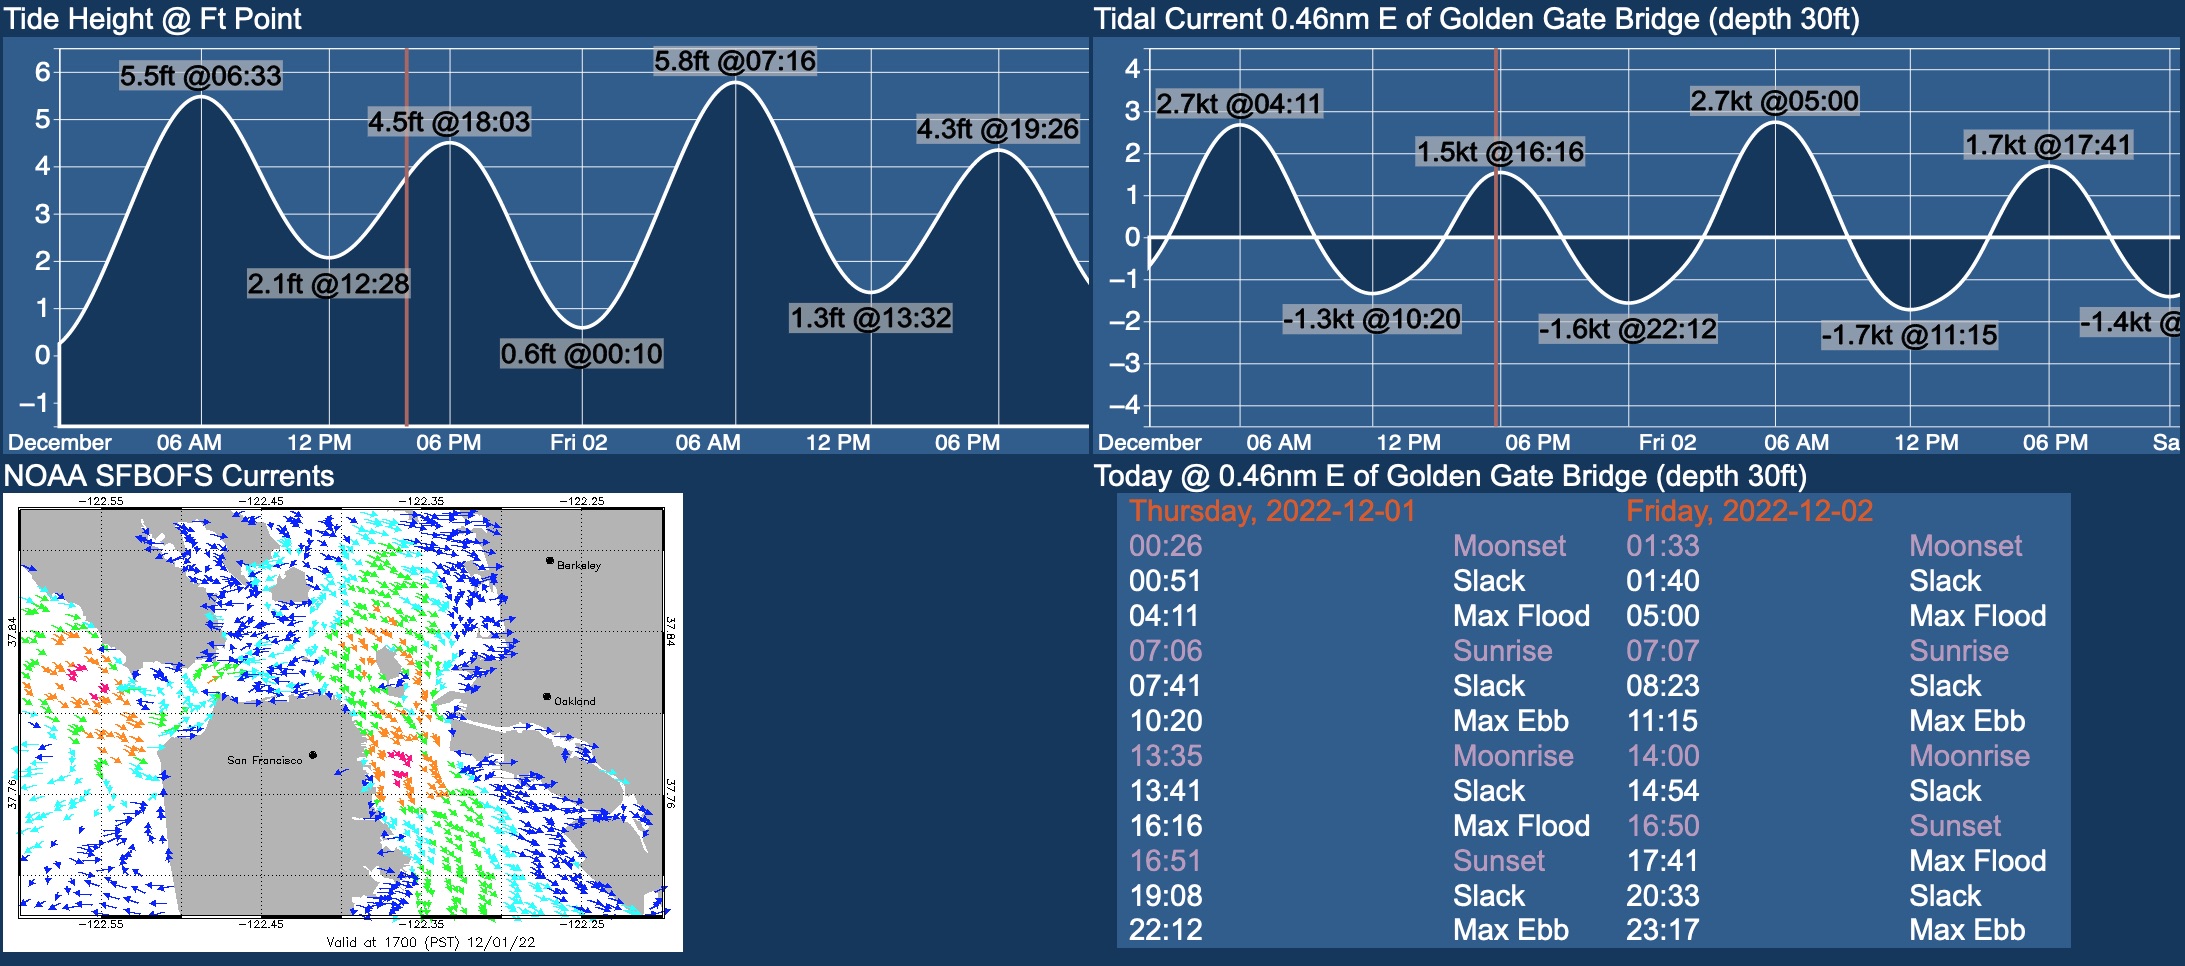
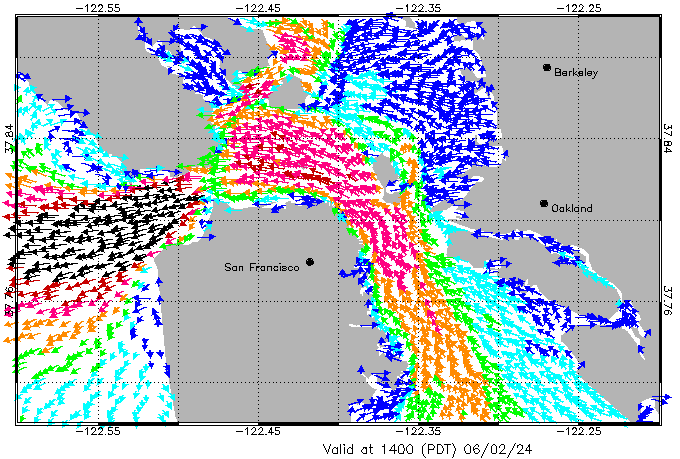
Tidal data is from NOAA's tide station at Ft Point which has been in operation since the Civil War. Currents are modeled at a point just inside the Golden Gate Bridge by NOAA's Operational Forecast System (OFS). Beware - the local tide book uses a point just outside the GG Bridge close to Pt Diablo. Some current timings and astronomical data come from the XTide program which implements NOAA's harmonic tidal model.
SFBay Currents
(Not Currently Active)
The SF Bay current graphics are from NOAA's SF Bay Operational Forecast System (OFS or SFBOFS) which runs a numerical model of bay tides/currents every six hours and produces hourly forecasts.
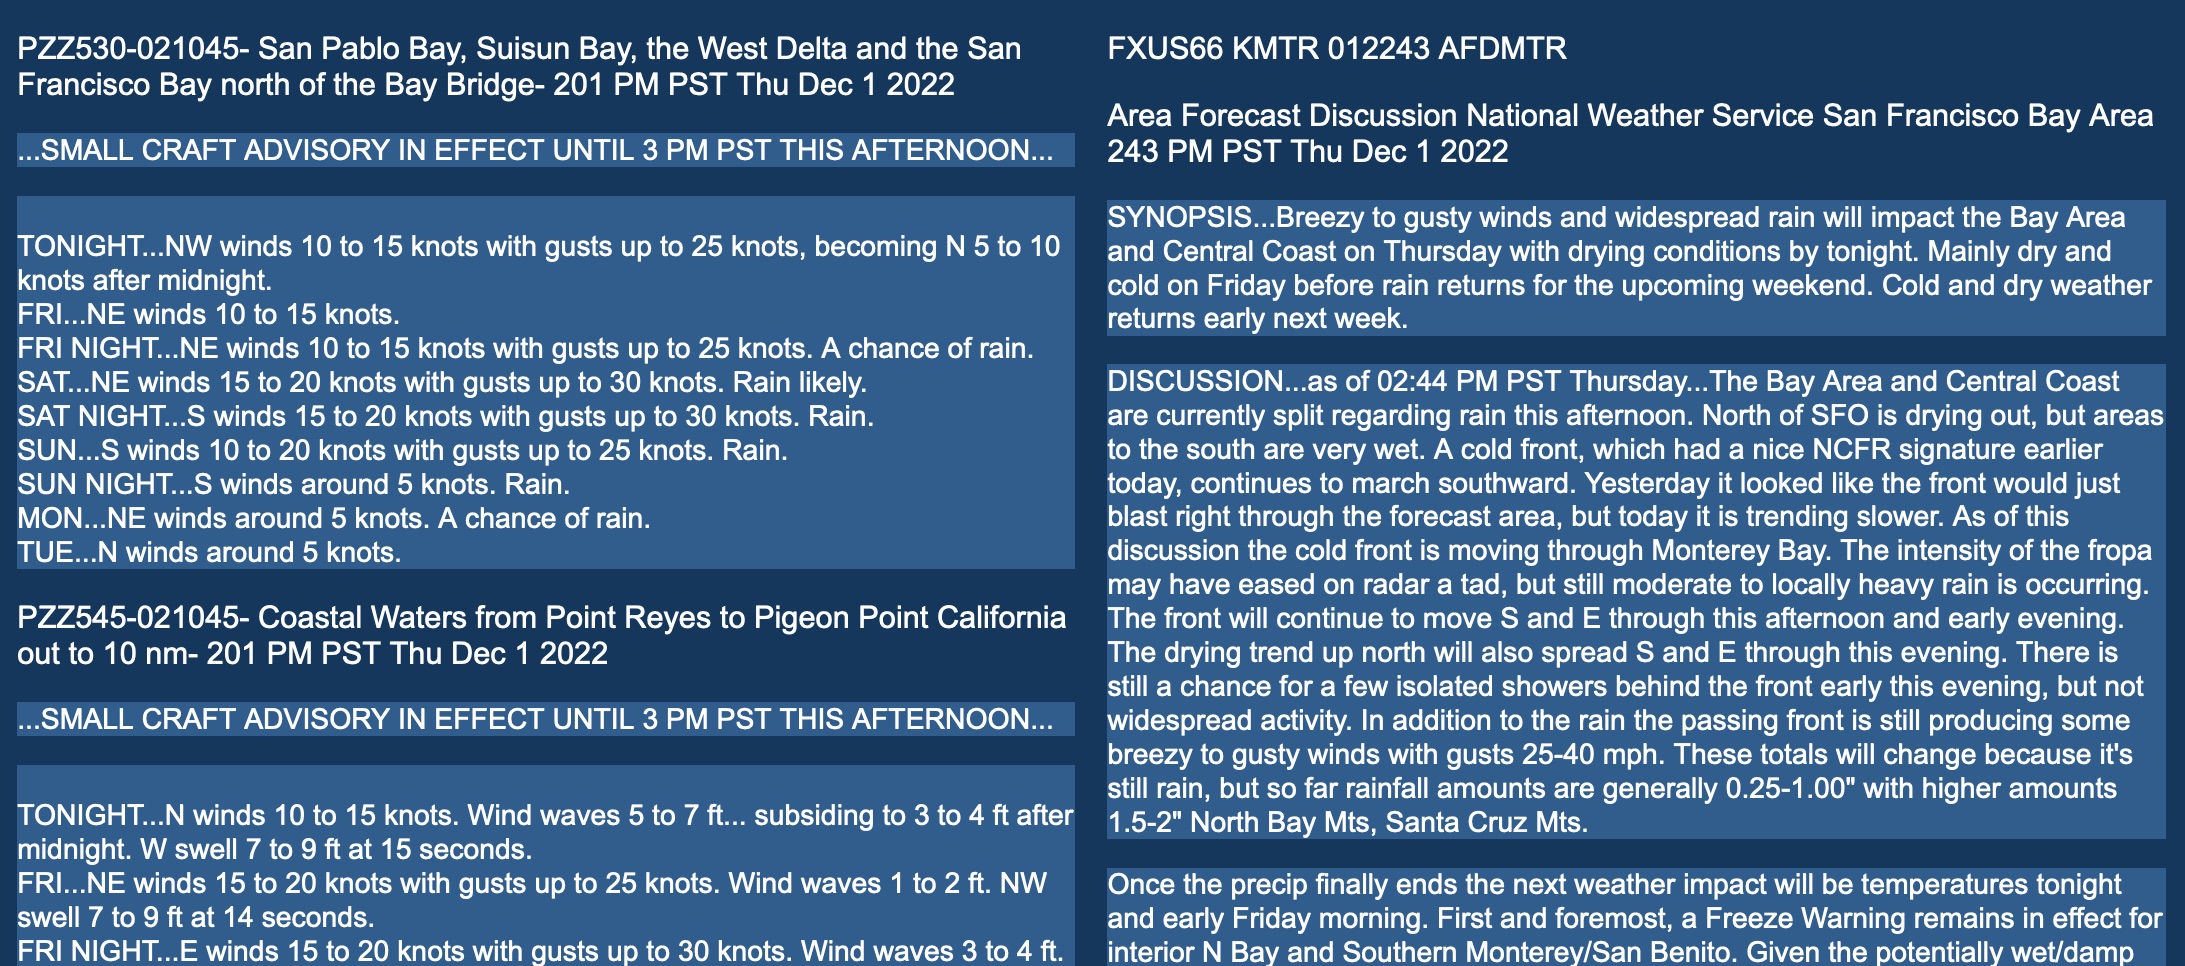
Text forecasts for the Bay Area and nearby waters are produced by the National Weather Service (NWS) SF Bay Weather Field Office (WFO) in Monterey which develops and runs some of the Navy's weather models.
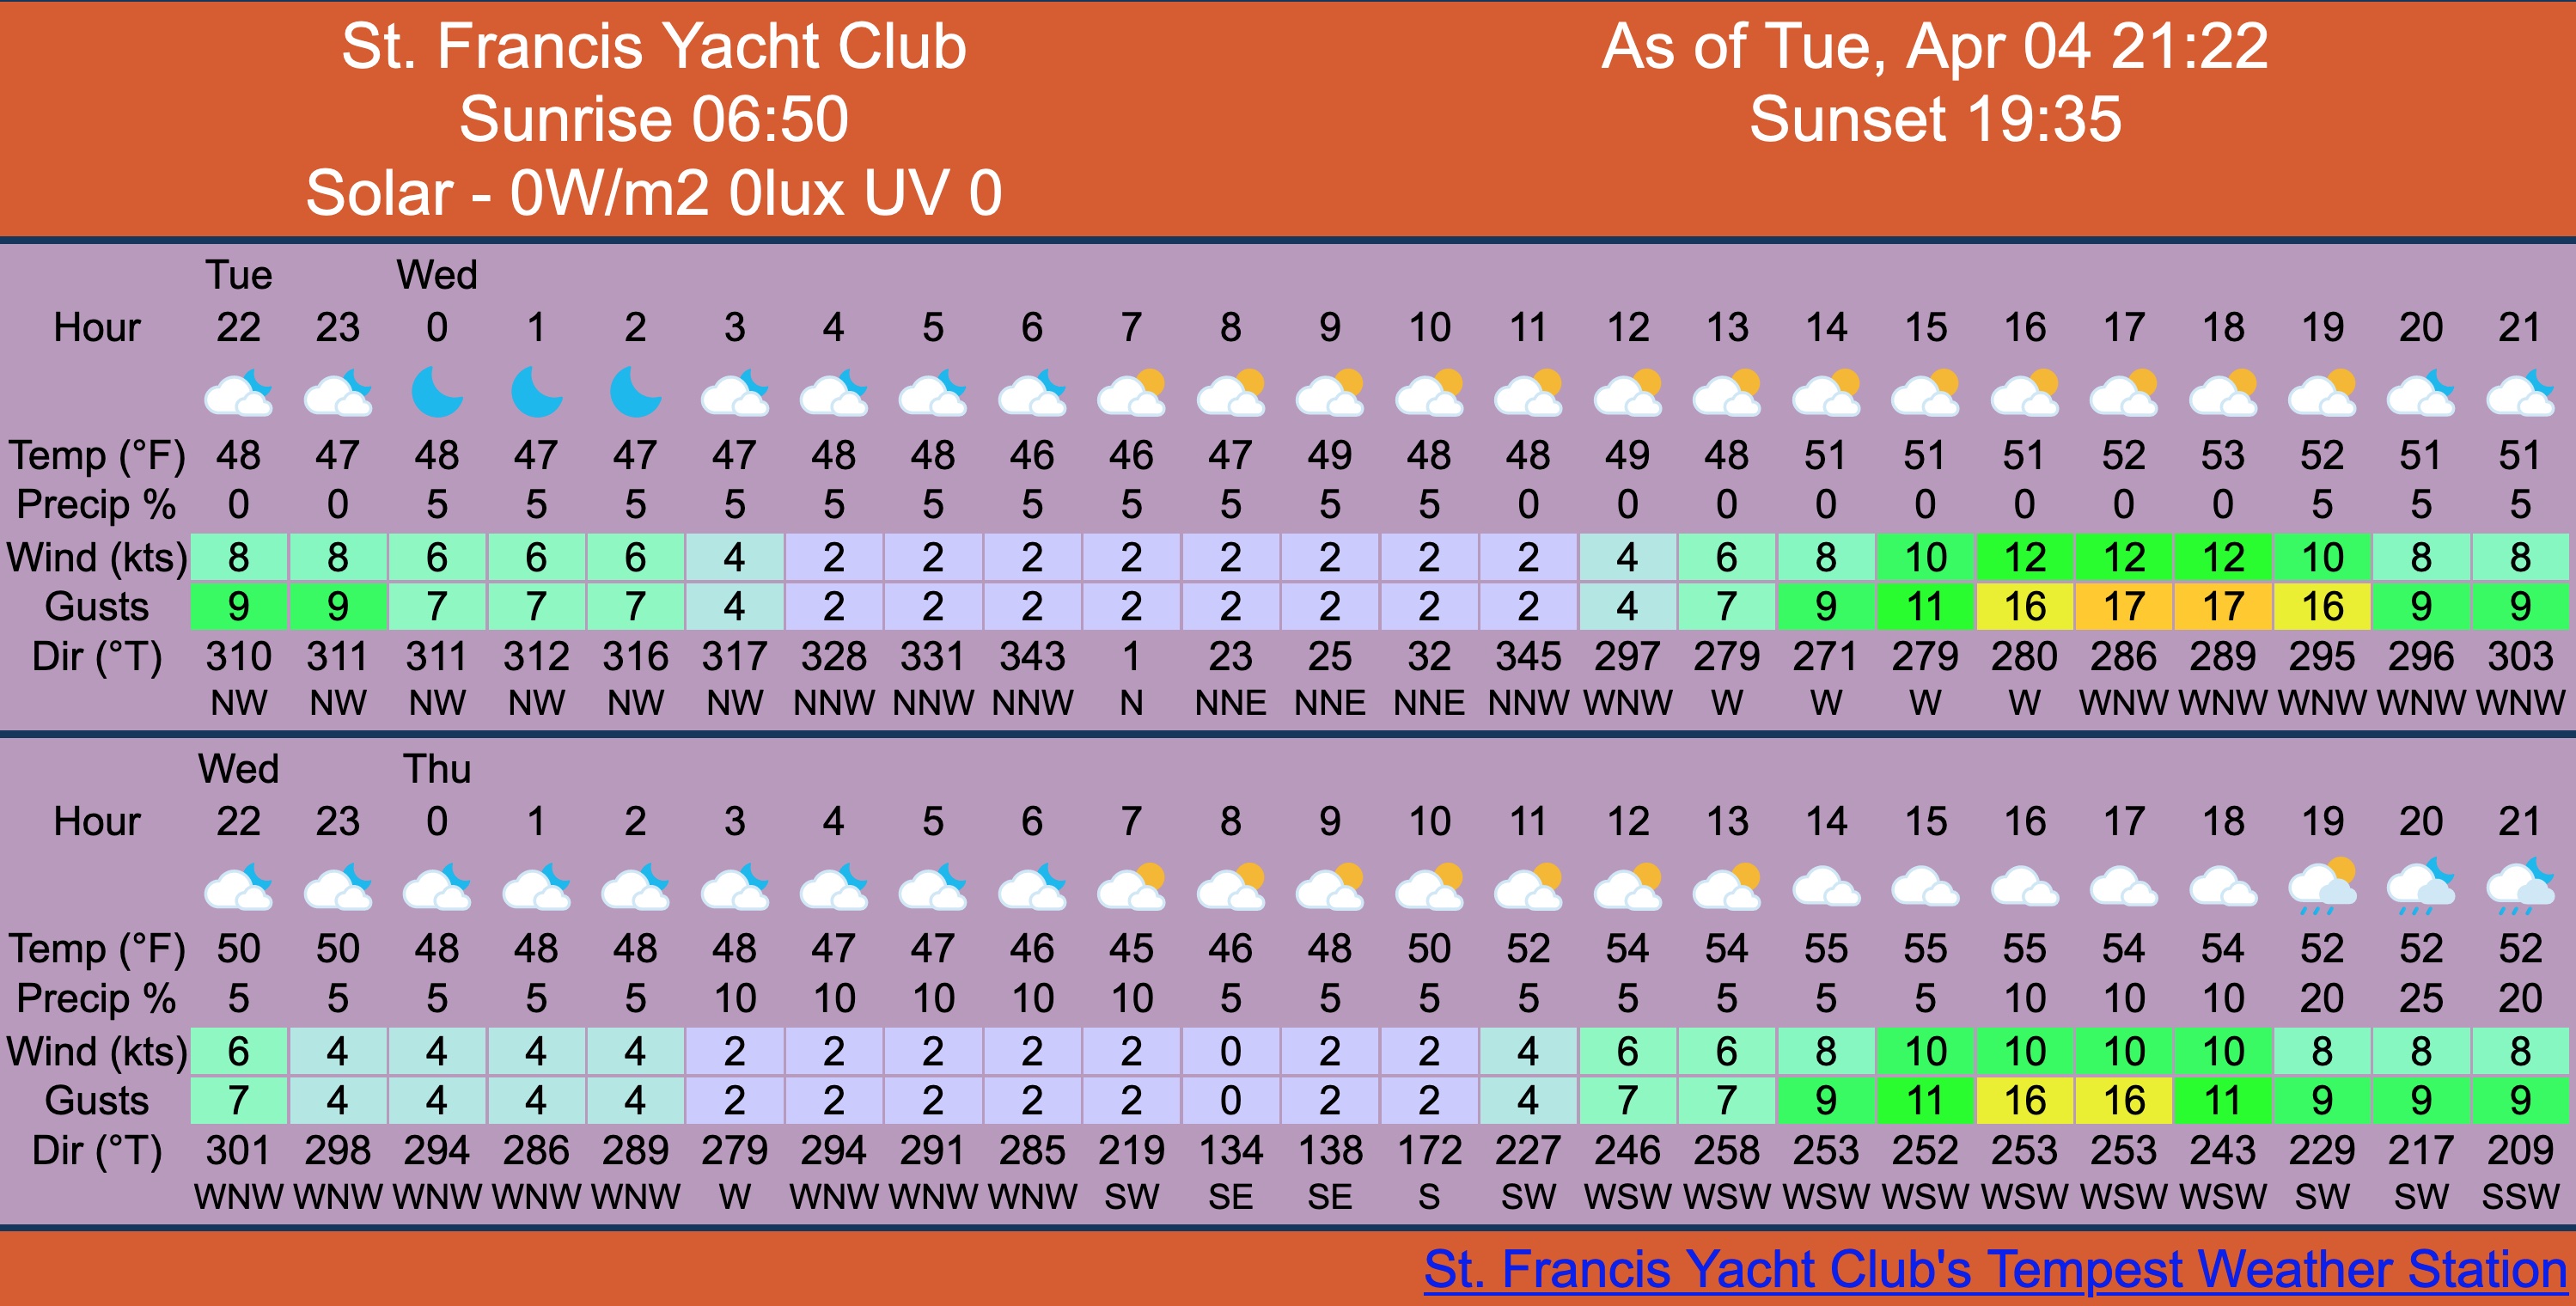
WeatherFlow combines the data it gathers from customer weather stations with NOAA models to produce forecasts tailored to customer locations and different activities. They also run the popular sports weather web sites and apps SailFlow, iWindSurf, and iKiteSurf. WeatherFlow uses the data from the Tempest weather stations at the City clubsite and Tinsley Island as input for the custom local forcasts.
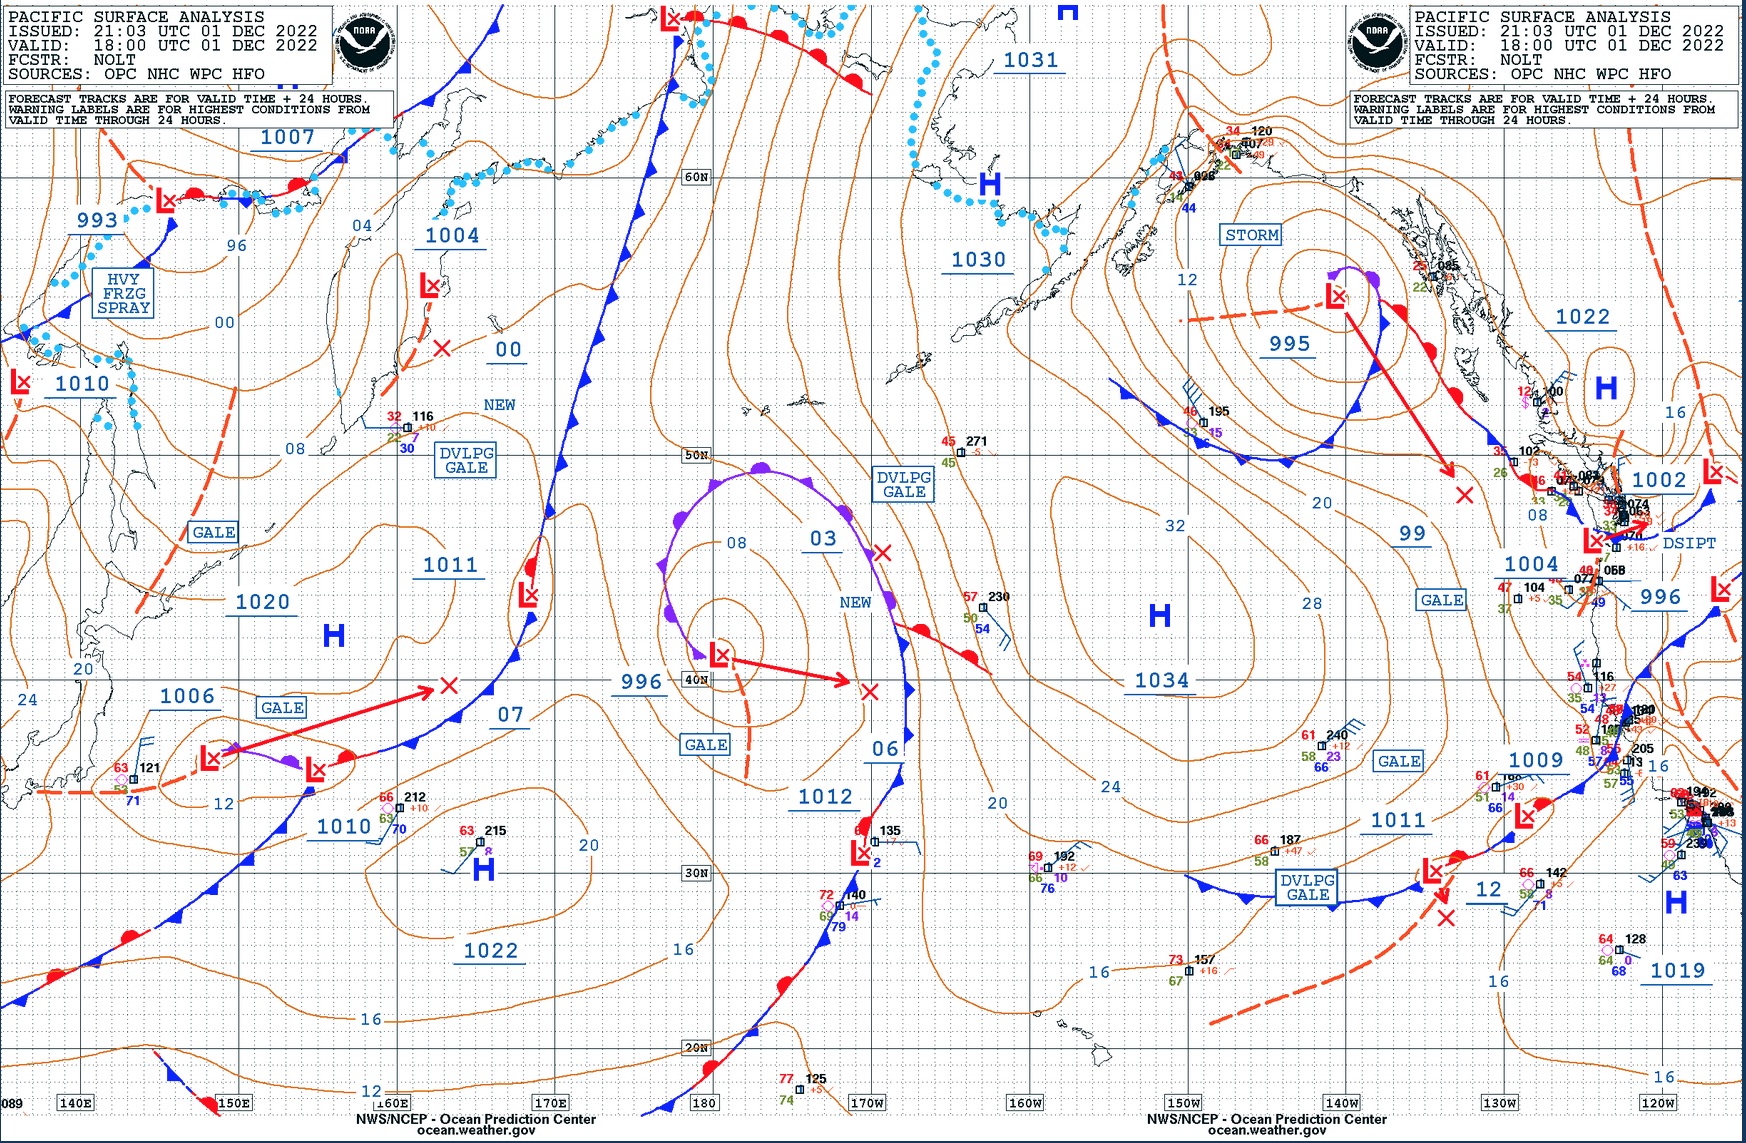
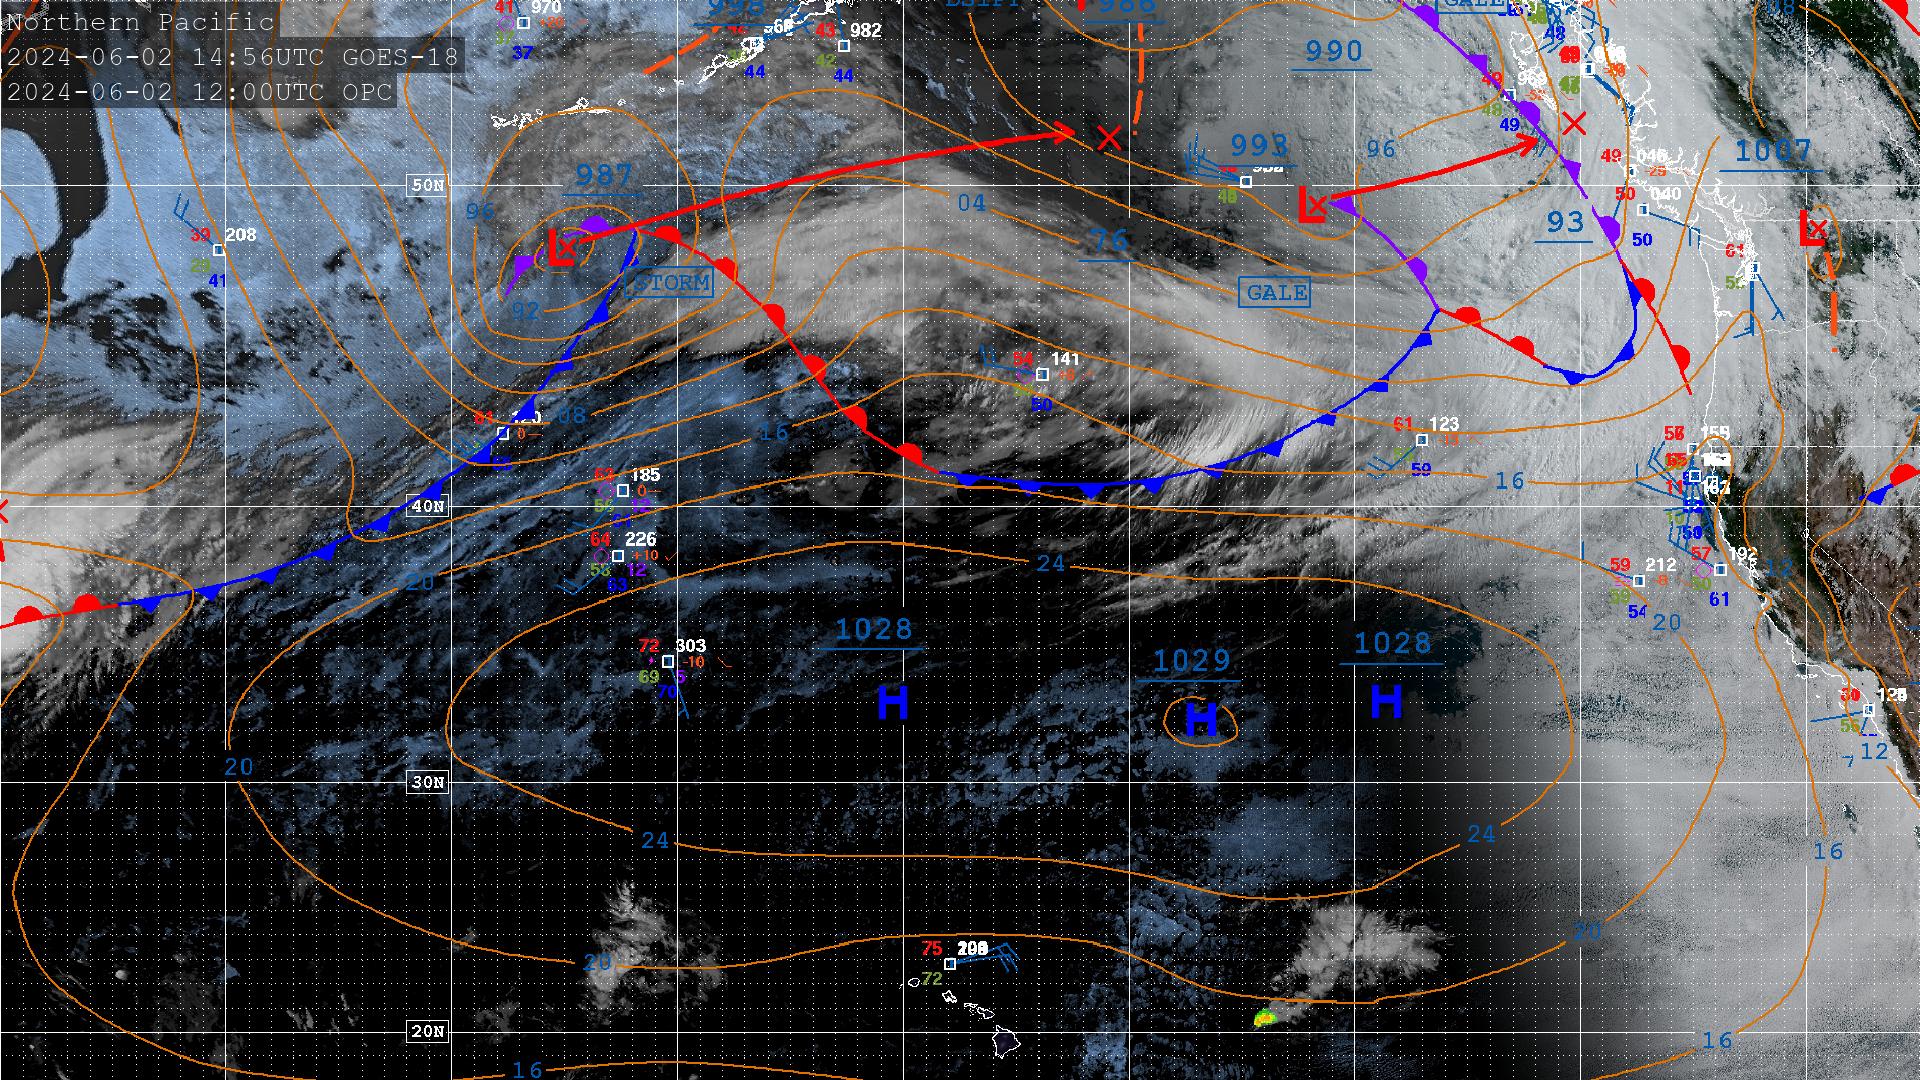
The surface analysis chart is produced by human forecasters at NOAA's Ocean Prediction Center (OPC). They have other predictive charts for the North Pacific (and elsewhere) that go out ~96 hours.
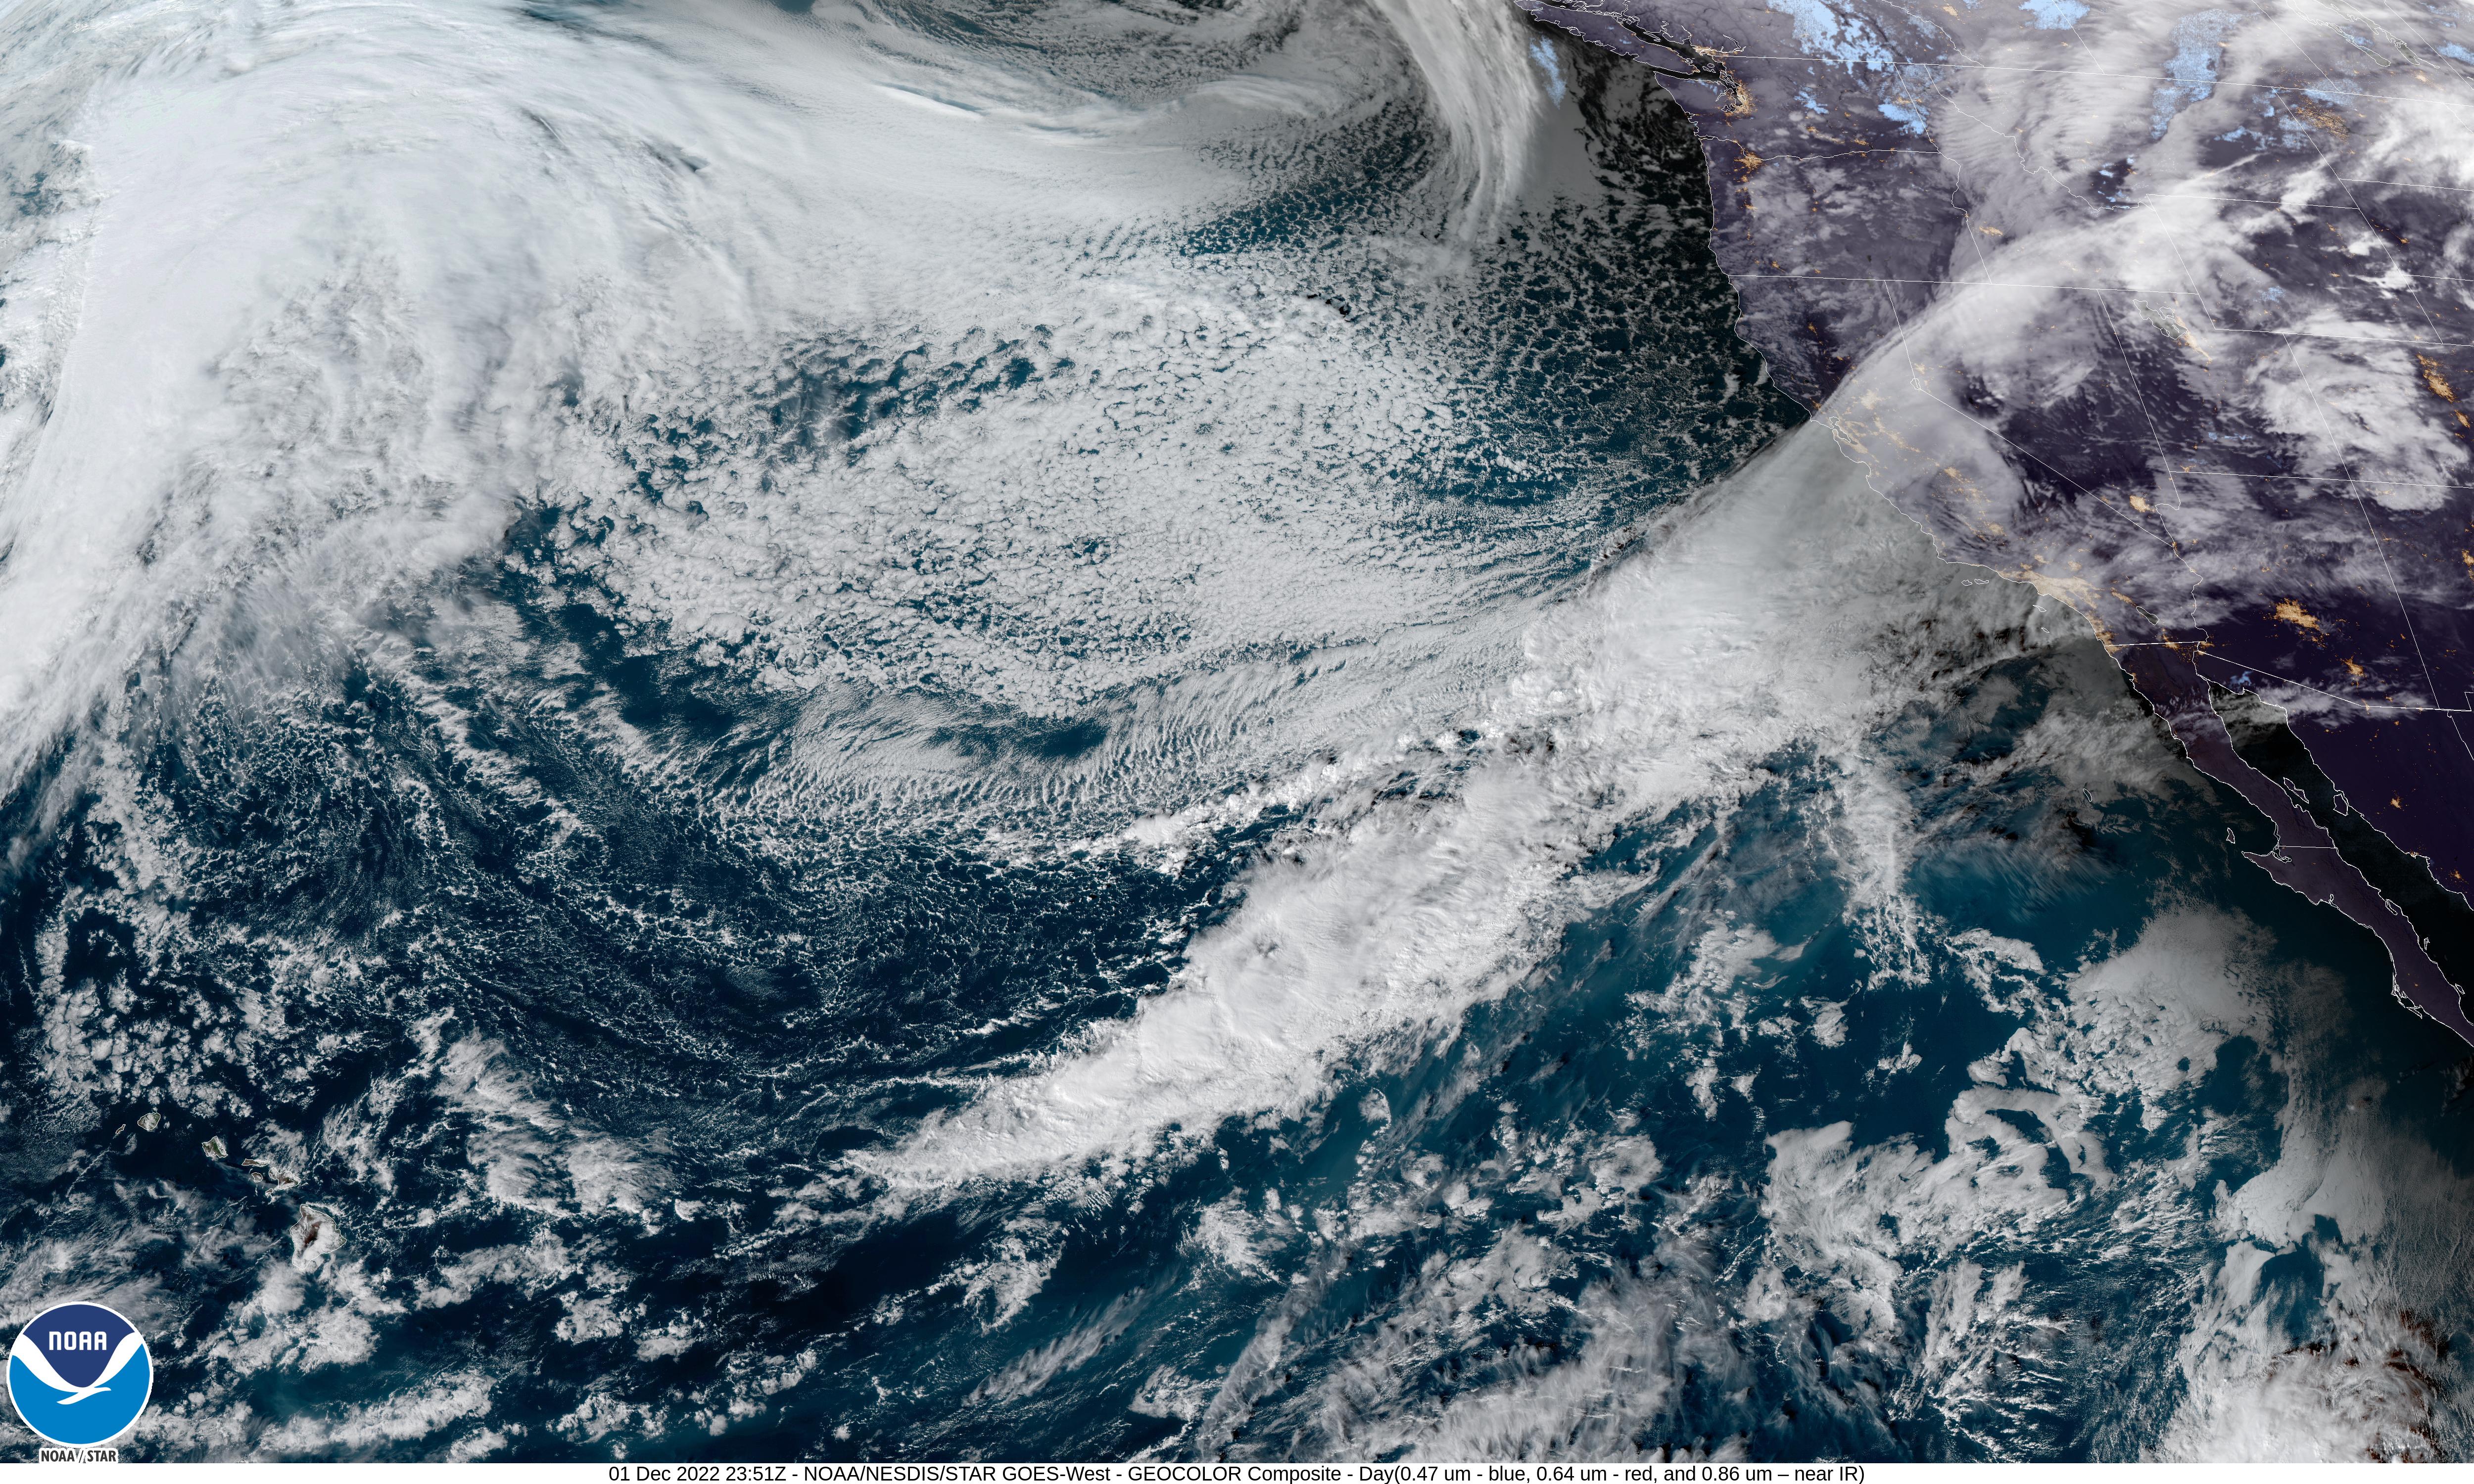
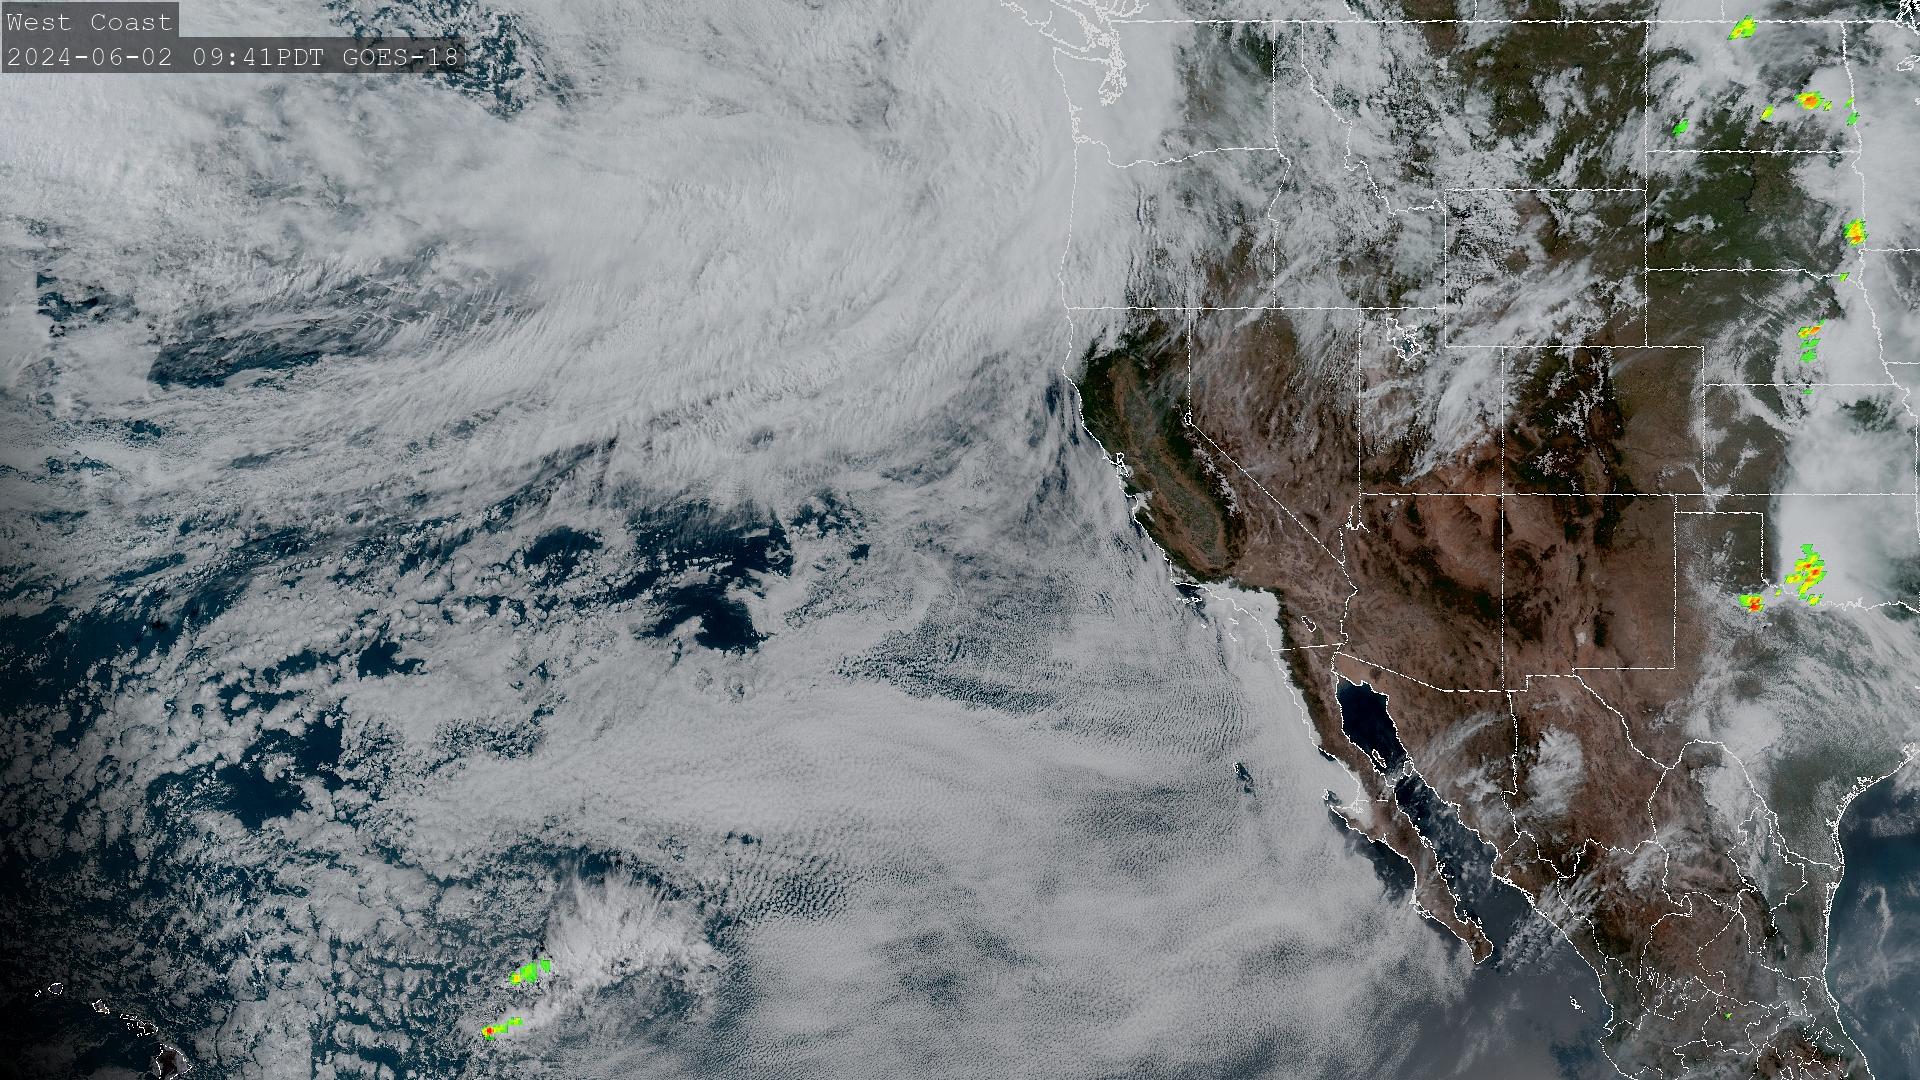
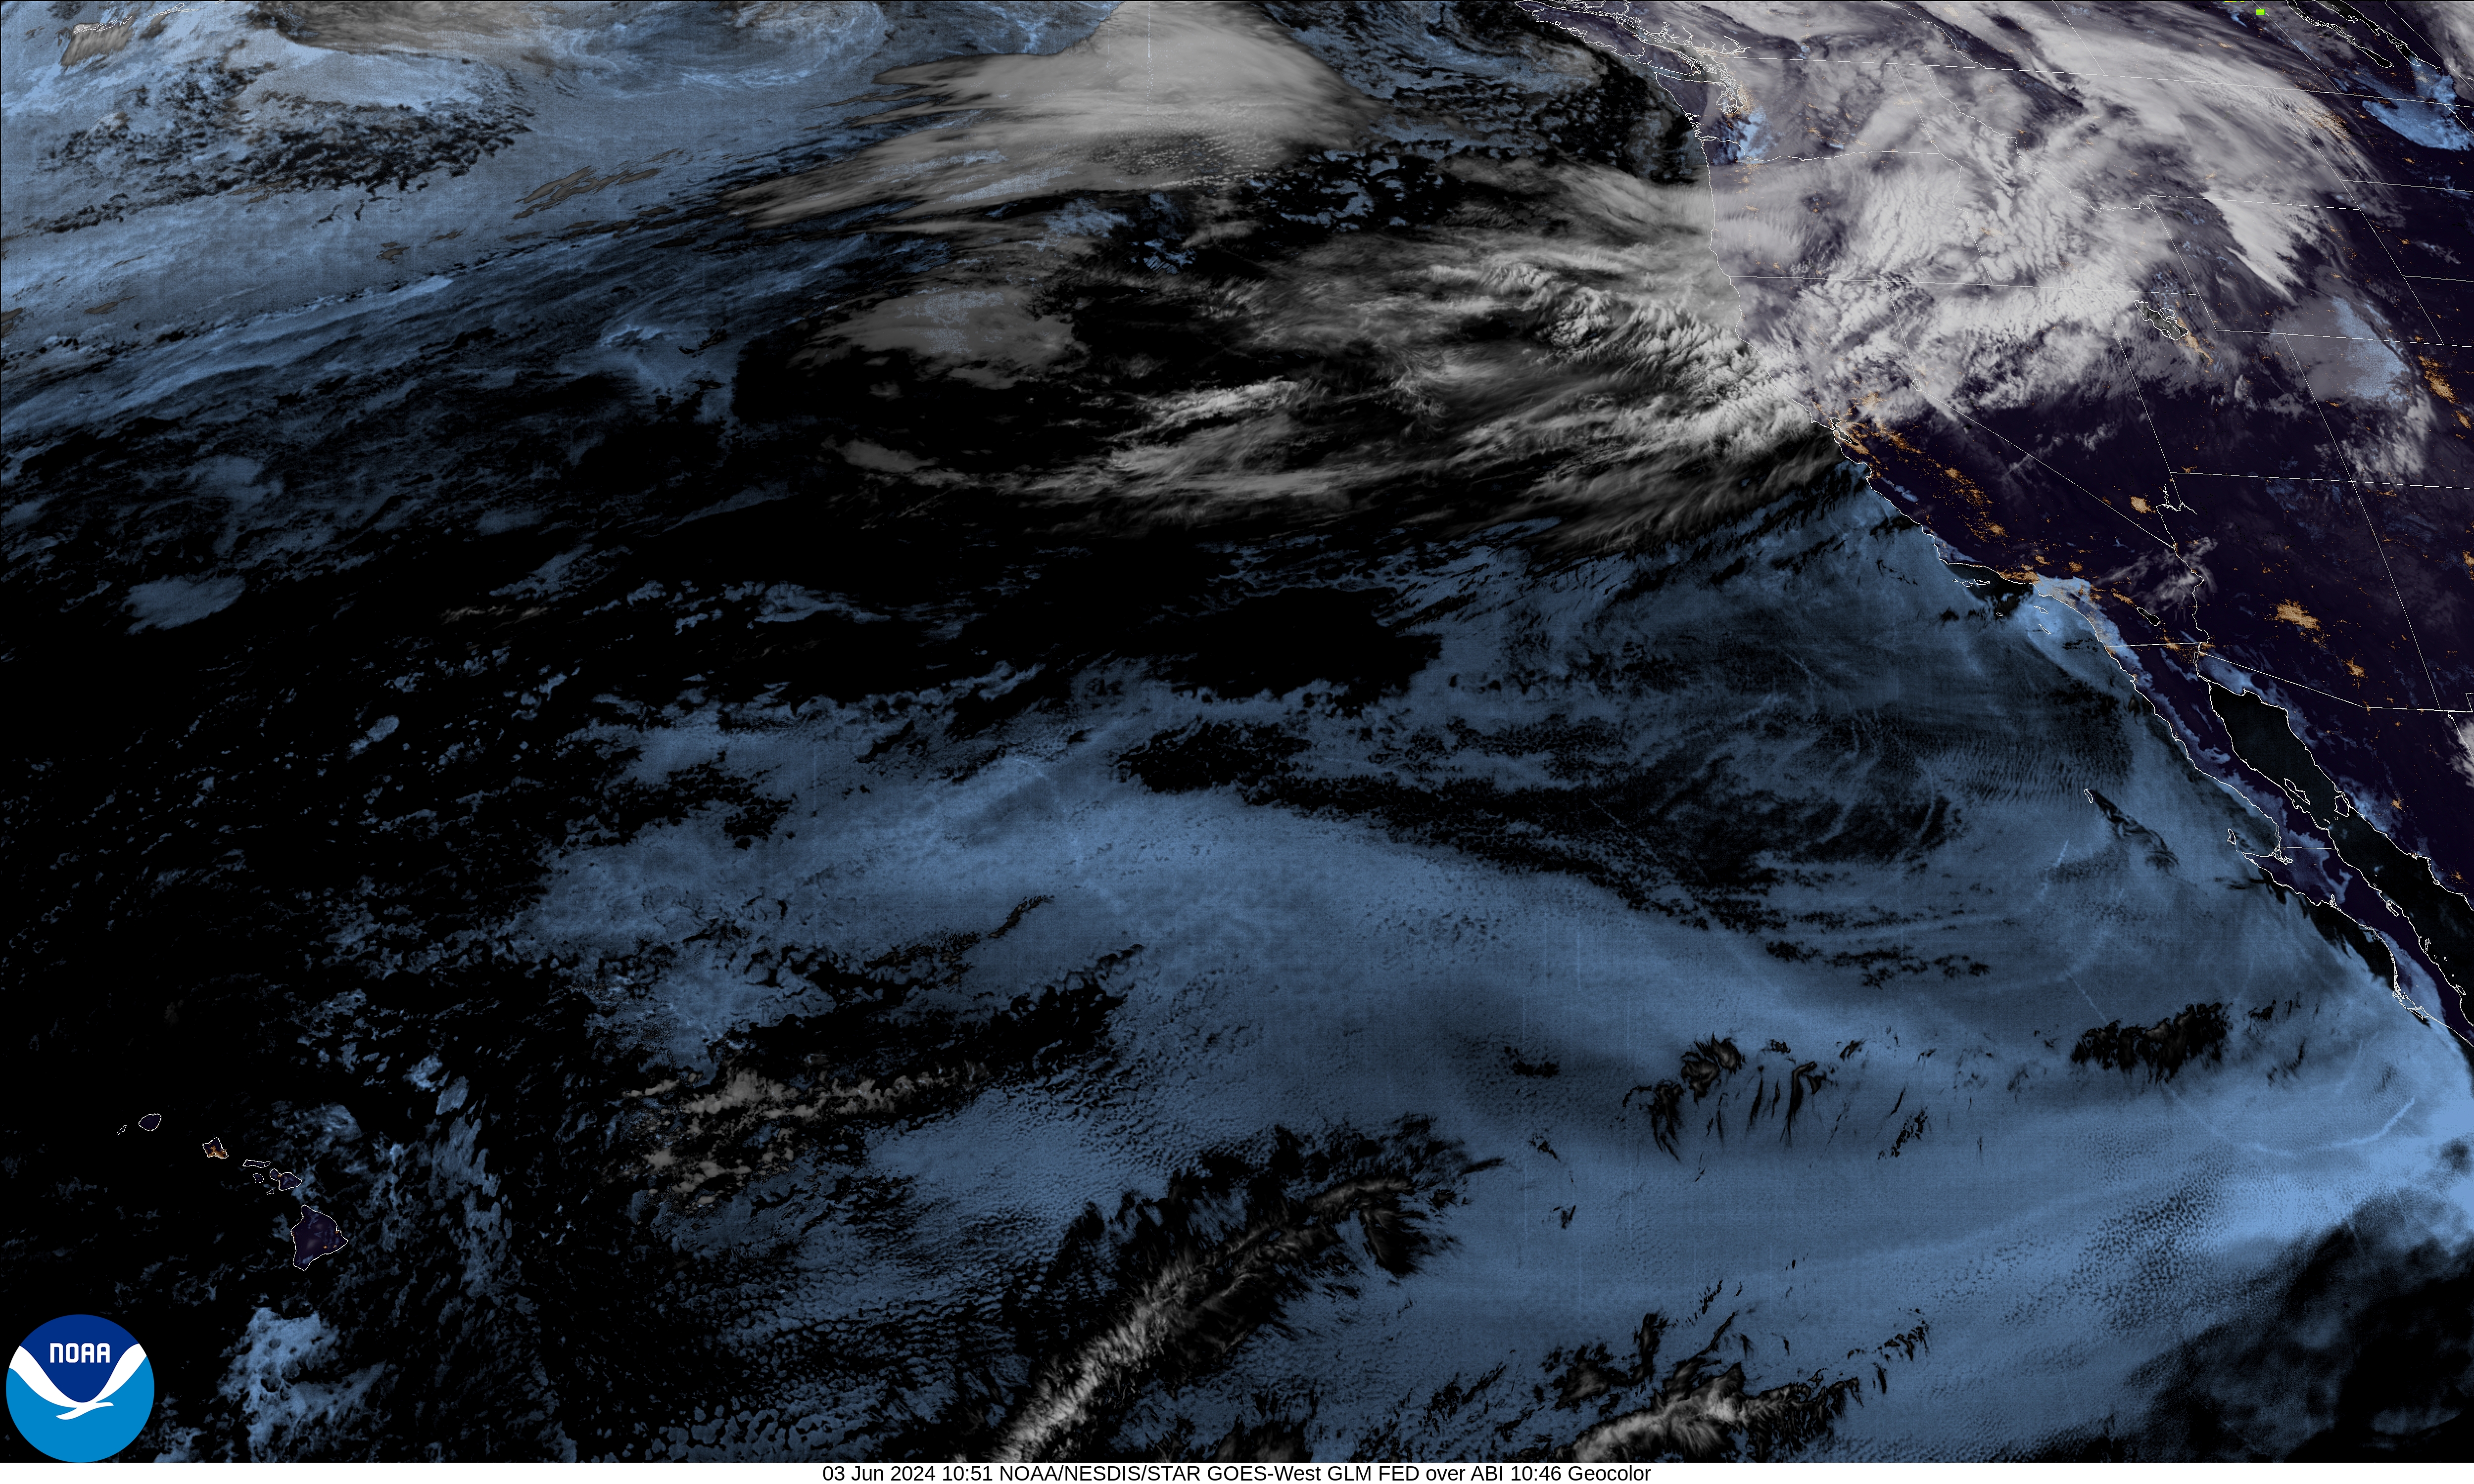
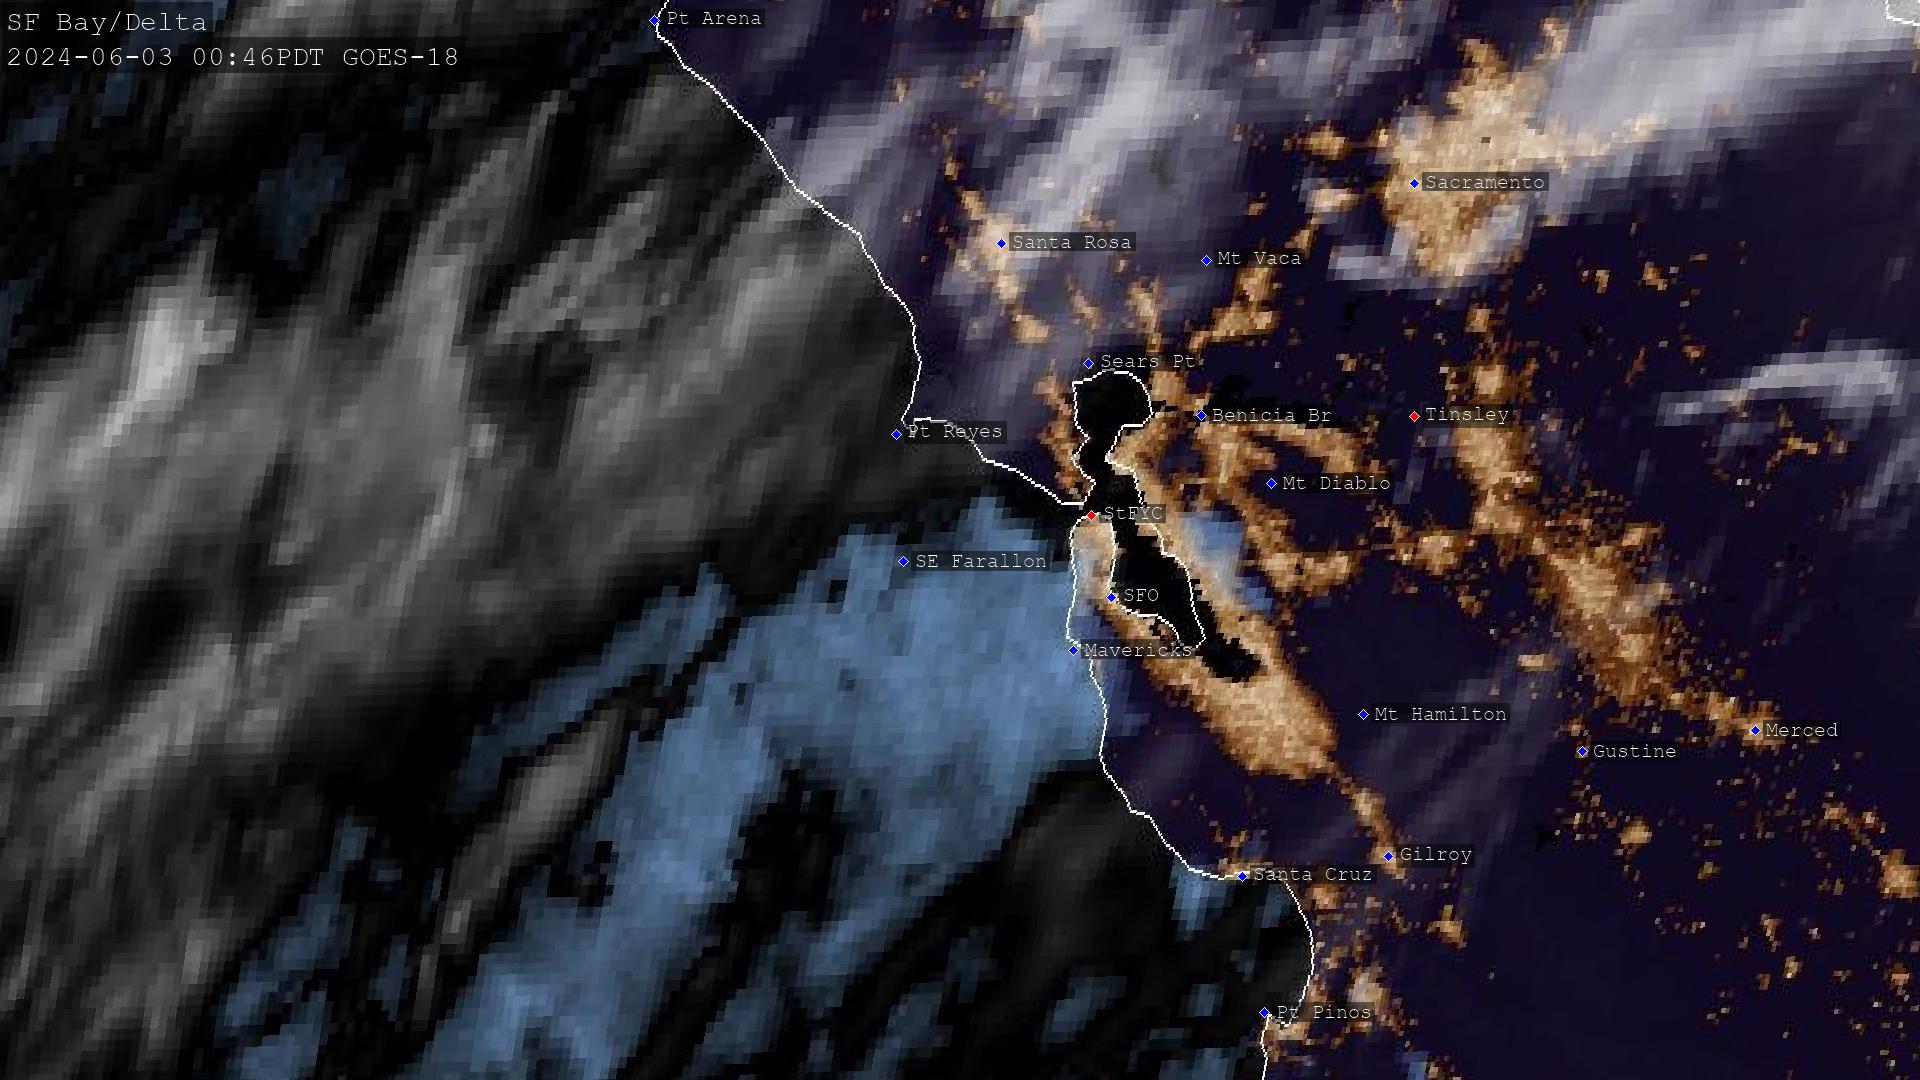
GOES-WEST (aka GOES-18) satellite images come from the National Environmental Data and Information Service (NESDIS) repository. Raw images are processed (reprojected to Mercator, cropped, etc) using locally-developed image processing code. The GeoColor algorithm used to color the images was developed at CIRA/RAAMB.
Time-lapse MPEG movies are created locally from the satellite images using FFmpeg.
National Radar & Warnings, Cloud Tops
NOAA has made an effort to make its various data and forecast products available on the Internet in many forms. The National Radar map overlays recent NEXRAD radar mosaics on top of current hazard, watch, and warning areas. More information is available from NOAA's NowCOAST and Weather & Hazards data viewers.
Data Ingestion and Processing
All data is ingested and processed on a Raspberry Pi 4 at StFYC which also runs the web & websocket servers that provide these pages. Scripts and programs are written in C, bash, Python, and Go.
Web Page, Map Display and Graphing
These web pages are written using a combination of raw HTML, CSS, and Javascript (aka ECMAscript) with help from the D3 graphing and data manipulation package and the OpenLayers & ESRI ArcGIS mapping packages.